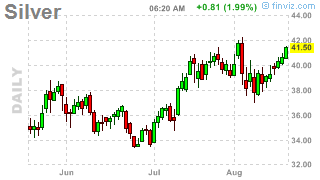
I am a big believer in Silver - Also you will see in various postings of mine earlier - I have discussed all the ongoing manipulation of metals - along with charts.
Before I get to the article - I also want to say, if you are familiar with the
webbot - then you know they are pretty much on target with what will be happening. Something keeps coming up in the language at various times. What might that be?
Silver!!
Silver keeps being mentioned in the Alta Reports - one says next year Silver will be from $600 to $800 per ounce!! Imagine That!! Compared to under $15.00 today per ounce. Recently in the language there was a mention of silver, it was where it would be $24.00 per ounce one day and just days later - it would shoot up to $350.00 per ounce!! NOW Imagine That!!
Is the above information guaranteed? NO - Do not take that information as gospel - I am simply relaying what it says happens. Of course I can HOPE!!
So, knowing this language has been out there about Silver - I like to see what news is around regarding it.
I found a wonderful article today - from someone I follow and is truly a Silver Expert.
Ted Butler - he has a newsletter called "Silver Seek".
He had some great information today, which is encouraging to me, that the
Webbot Alta language may just be on to something.
link to article:
http://news.silverseek.com/TedButler/1249414304.php"For instance, despite a sharp $3.50 decline from the $16 level in early June, no metal was liquidated in the combined holdings of the silver EFTs. This was very much at odds with the normal pattern of some liquidation in past price declines. Instead, combined silver holdings rose to new records. Plus, a number of new investment vehicles buying physical silver were introduced during this period. By my count, as many as 15 million ounces of silver may have been accumulated by existing and new ETF vehicles in the past month, adding to the hundreds of millions of ounces accumulated and taken off the market over the past few years. This contrasted with a notable liquidation in gold ETF holdings, even though the gold price declined in much smaller percentage terms over the same time period."Above you can read, silver holdings have increased more than gold.
Oh, by the way, in case you did not know - there is actually less Silver in the World than there is Gold!! Also Silver is used for many more applications than gold is. Silver is an industrial metal besides an investment metal.
"In addition, Silver Eagle sales from the US Mint have accelerated over the past two months, with July recording the second largest monthly sales of the year. Gold Eagle sales, while still very strong for the year, recorded the second lowest monthly sales for the year in July. The Mint is on a pace that could result in more than 28 million ounces of Silver Eagles being produced and sold this year, the most in history and roughly three times larger than the average for the past decade. To put this number in perspective, the 28 million ounces potentially consumed in new Silver Eagles would represent more than 75% of all the silver mined annually in the US, the world’s eighth largest producer. This takes silver off the market and tightens physical supply. For comparison purposes, Gold Eagle sales, on the current pace, will consume 15% of gold mine production in the US, the world’s fourth largest producer."As you can read - almost all the silver produced is consumed, compared to Gold - only 15% is consumed.
"Now there are promising signs of change, the most important being the appointment of a dynamic new chairman at the CFTC, Gary Gensler. He brings to the Commission something rarely observed in the history of the CFTC, market experience and a sense of purpose. As I indicate in this new interview with King World News, Click Here
I think Gensler is already the best chairman in CFTC history, even though he has been on the job for little more than 2 months. I think he represents the best chance ever that the CFTC will terminate the decades-long silver manipulation. Someday, I may have to eat my words, but that day is not today. Let me explain why."
Since there is a new Chairman, Ted Butler feels there is a good chance the manipulation will end. He has a very good, but somewhat complicated explanation at the link. The explanation is detailed, so I would advice going to the link to read it completely.
The long and short of it is, hopefully with the new chairman - the obvious manipulation which has been ignored for decades will now come to an end. The manipulation is at that point where only fools involved with the manipulation can deny it. The data has gotten overwhelming and obvious. I am reinserting graphs here, that I have in a post farther down on the page.


With the new chairman and knowing almost all the silver is being taken that is produced in the U.S. - then it does not seem unfeasible for Silver to shoot to the moon.
We can only Hope and Watch the market.
Have you positioned yourself for the manipulation of the metals market to possibly and finally come to an end?
 One Year Chart


